Oxford's claimant count rose to 3,095 in July, yet under-25 claims fell 4.1% against a 9.7% rise UK-wide. Only five of 64 South East areas saw a fall.
The number of Oxford residents claiming unemployment-related benefits rose to 3,095 in July, but the increase came entirely from people aged 25 and over. Claims by under-25s fell here while they rose sharply across the rest of the country.
The figures are in the ONS claimant count for July 2026, released on 18 August. They cover the Oxford City Council area, not the wider county.
Oxford went one way, the country went the other
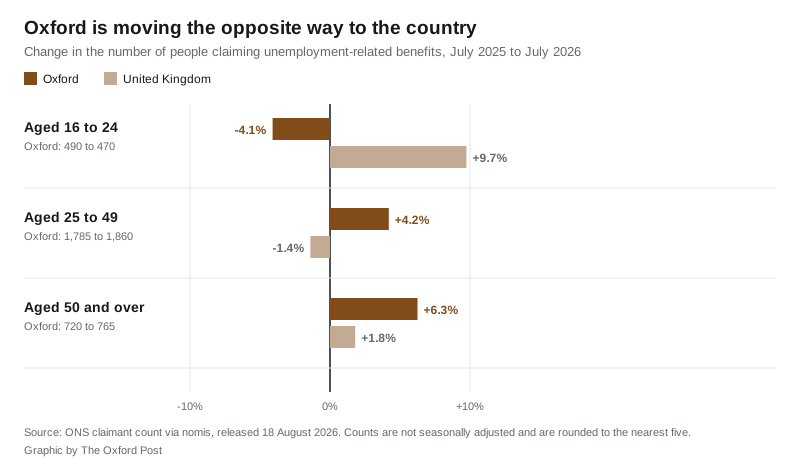
Oxford’s total was 2,995 in July 2025 and 3,095 this July, a rise of 100. That works out at 2.6 per cent of residents aged 16 to 64. Underneath the total, the three age bands moved in different directions:
- aged 16 to 24: 490 to 470, down 20, a fall of 4.1 per cent
- aged 25 to 49: 1,785 to 1,860, up 75, a rise of 4.2 per cent
- aged 50 and over: 720 to 765, up 45, a rise of 6.3 per cent
The under-25 figure is the one that stands out. Across the UK, claims by 16 to 24-year-olds rose from 302,835 to 332,335 over the same twelve months, an increase of 9.7 per cent. Across the South East they rose 12.2 per cent.
Of the 64 local authorities in the South East, only five recorded a fall in under-25 claims. Oxford was 63rd on that measure, meaning its fall was the second steepest in the region. Only Epsom and Ewell, down 10.8 per cent, dropped further.
It is also the steepest fall in Oxfordshire. Every other district in the county was flat or moved less:
- Oxford: 490 to 470, down 4.1 per cent
- South Oxfordshire: 255 to 250, down 2.0 per cent
- Cherwell: 365 to 360, down 1.4 per cent
- Vale of White Horse: 295 to 295, unchanged
- West Oxfordshire: 205 to 250, up 22.0 per cent
The rise sits with people in their forties
If the increase is not among young people, it is worth asking where it is. The 25 to 49 band accounts for most of it, and within that band the sharpest single movement was among people aged 40 to 44, up from 350 to 400.
That runs against the national pattern too. UK claims in the 25 to 49 band fell 1.4 per cent over the year, from 982,545 to 968,470. In Oxford they rose.
Oxford’s rate of 2.6 per cent is the highest of the five Oxfordshire districts. West Oxfordshire and South Oxfordshire are both on 1.9 per cent. Set against the wider region, though, Oxford is unremarkable: it ranks 36th of the 64 South East authorities, well below Slough on 6.0 per cent and Thanet on 5.4 per cent.
The longer view is less comfortable. In July 2019 the city recorded 1,930 claimants. The July 2026 figure is 60 per cent higher.
Blackbird Leys 5.1%, Summertown 0.6%
Ward figures show how unevenly this sits across the city. These are the rates for July 2026, as a share of each ward’s 16 to 64 population:
| Ward | Rate |
|---|---|
| Blackbird Leys | 5.1% |
| Barton & Sandhills | 4.7% |
| Littlemore | 4.5% |
| Rose Hill & Iffley | 4.3% |
| Northfield Brook | 3.8% |
| Temple Cowley | 3.6% |
| Cowley | 3.4% |
| Donnington | 3.4% |
| Churchill | 3.2% |
| Hinksey Park | 3.1% |
| Wolvercote | 2.9% |
| Osney & St Thomas | 2.7% |
| Headington Hill & Northway | 2.6% |
| St Clement’s | 2.3% |
| Cutteslowe & Sunnymead | 2.2% |
| Lye Valley | 2.2% |
| Quarry & Risinghurst | 1.9% |
| Marston | 1.7% |
| Carfax & Jericho | 1.5% |
| St Mary’s | 1.5% |
| Headington | 1.3% |
| Summertown | 0.6% |
| Walton Manor | 0.6% |
| Holywell | 0.2% |
Blackbird Leys, at 5.1 per cent, is more than eight times Summertown’s 0.6 per cent. Both are residential neighbourhoods in the same city, a few miles apart. The bottom of the table is dominated by central and north Oxford wards where much of the housing is college and university accommodation, so those rates should be read with care.
The 24 ward counts add up to 3,100 against the city total of 3,095. That is rounding, not a discrepancy: ONS rounds every one of these figures to the nearest five.
What it means for you
The claimant count is not the unemployment rate, and it is worth being precise about what it does and does not capture. The ONS quality and methodology information states plainly that “the Claimant Count does not attempt to measure unemployment”. It counts people claiming benefits principally because they are out of work, which is a different thing.
Three points follow from that:
- Some people in work are included. The ONS notes that “some part-time workers, with very low earnings, may be eligible while seeking full-time work”.
- Some people out of work are excluded, including those looking only for part-time work and those whose partner earns above a threshold.
- These figures are not seasonally adjusted. July always carries school and college leavers, which is why every comparison here is July against July.
If you are claiming, or think you should be, Universal Credit is the route for most working-age people and is claimed through GOV.UK. Oxford City Council’s benefits and support pages set out what else is available locally, and its council tax reduction scheme cuts the bill for people on a low income.
For the other side of the household ledger, our Oxford house prices page tracks what homes in the city are actually selling for, and our Oxford planning news page follows the applications that shape where new homes and jobs go.
Have your say
We read every message. To comment on this story, email the newsdesk and we may publish a selection of responses: hello@theoxfordpost.co.uk.